from ipyleaflet import Map, Marker, basemaps, basemap_to_tiles
m = Map(
  basemap=basemap_to_tiles(
    basemaps.NASAGIBS.ModisTerraTrueColorCR, "2017-04-08"
  ),
  center=(52.204793, 360.121558),
  zoom=4
)
m.add_layer(Marker(location=(52.204793, 360.121558)))
mLet’s make something Shiny and Interactive
import numpy as np
import matplotlib.pyplot as plt
r = np.arange(0, 2, 0.01)
theta = 2 * np.pi * r
fig, ax = plt.subplots(
  subplot_kw = {'projection': 'polar'}
)
ax.plot(theta, r)
ax.set_rticks([0.5, 1, 1.5, 2])
ax.grid(True)
plt.show()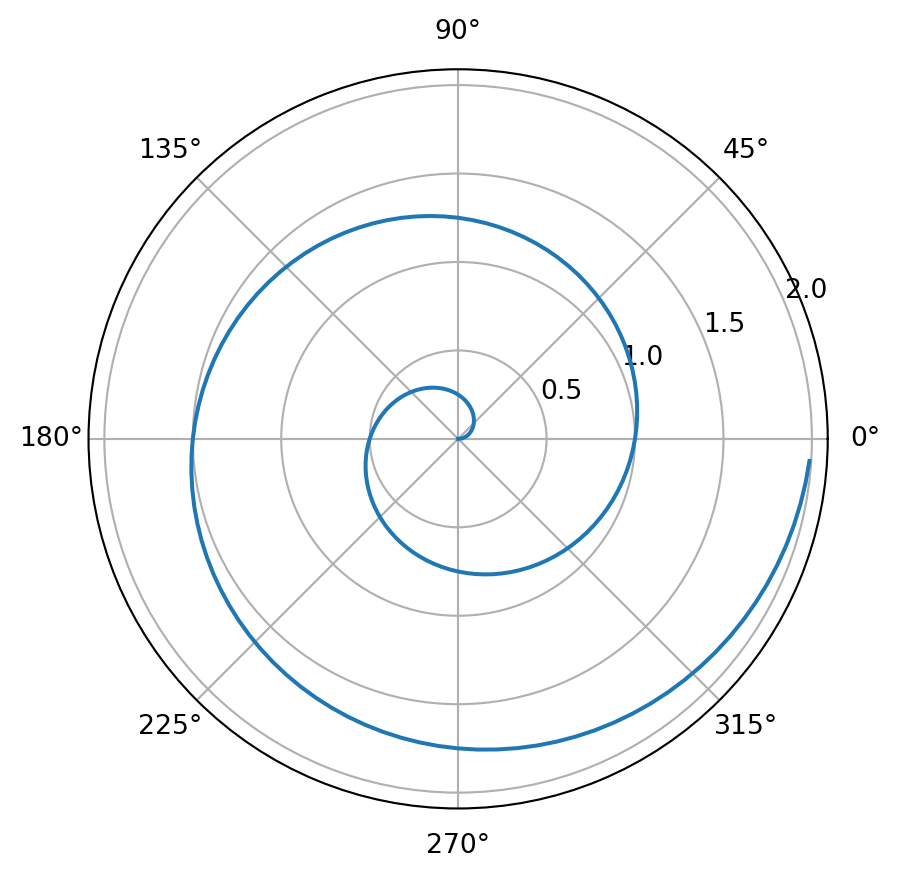
import ipywidgets as widgets

slider = widgets.IntSlider(value = 5, max = 10)
slider